Measure Manager
The Measure Manager allows you to customize the measures (values) displayed in the OLAP cube.
General
The General tab controls the display caption, calculation type, and data type.
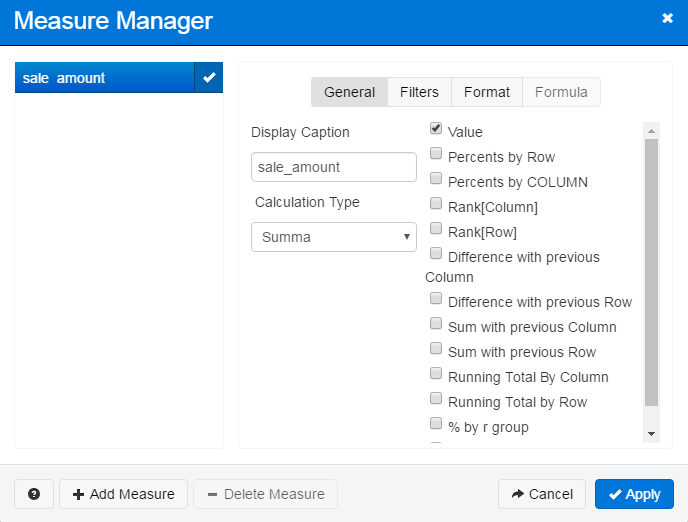
- Display Caption - This is the name of the measure as it appears in the OLAP cube.
- Calculation Type - The type of aggregation used for the data shown in the OLAP cube's cells. By default, the aggregation type is a sum.
Initially, each measure is set to display only the value. You can add additional measure data by checking the information you would like to show (Percents by row/column, rank, difference, etc.)
You can choose any number of aggregation methods to display for each measure. If you choose more than one method, they will appear side by side in the OLAP cube.
| Data | Description |
|---|---|
| Value | The numerical value that is the result of aggregating the values from the data source. |
| Percents by row | The percentage of the value in relation to the total row amount. Note: The calculation of percentages is done using the simple formula of (Value/Total) * 100. Hence, the result can be substantially more than 100%, if the measure is obtained as a result of a statistical function or calculating the average. |
| Percents by column | The percentage of the value in relation to the total column amount. Note: The calculation of percentages is done using the simple formula of (Value/Total) * 100. Hence, the result can be substantially more than 100%, if the measure is obtained as a result of a statistical function or calculating the average. |
| Rank [column] | All values in the column ranked by the size of the value. The largest value in the column is rank 1. |
| Rank [row] | All values in the row ranked by the size of the value. The largest value in the row is rank 1. |
| Difference with previous column | Difference between the value and the value in the previous column. |
| Difference with previous row | Difference between the value and the value in the previous row. |
| Sum with previous column | Sum of the value and the value in the previous column. |
| Sum with previous row | Sum of the value and the value in the previous row. |
| Running total by column | Vertical sum of items up to and including the current item. |
| Running total by row | Horizontal sum of items up to and including the current item. |
| % by r group | The percentage of the total row group amount. |
| % by c group | The percentage of the total column group amount. |
Filters
The Filters tab includes options for limiting the values shown to those over or under a specified amount.
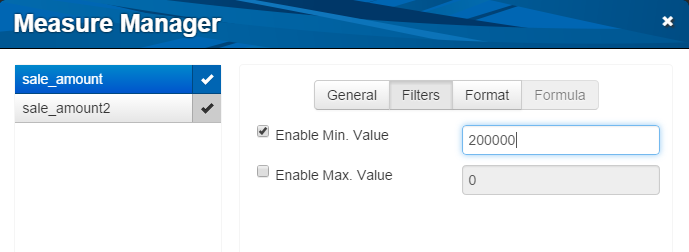
- Enable Min. Value - Check to only show amounts over the amount you specify.
- Enable Max Value - Check to only show amounts under the amount you specify.
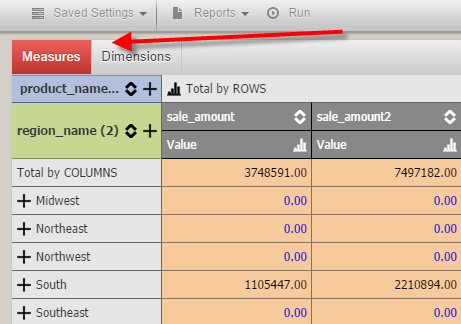
When one or more measures has a filter on it, the Measures button on the OLAP cube turns red:
Format
The Format tab controls how the measure values display in the cells.
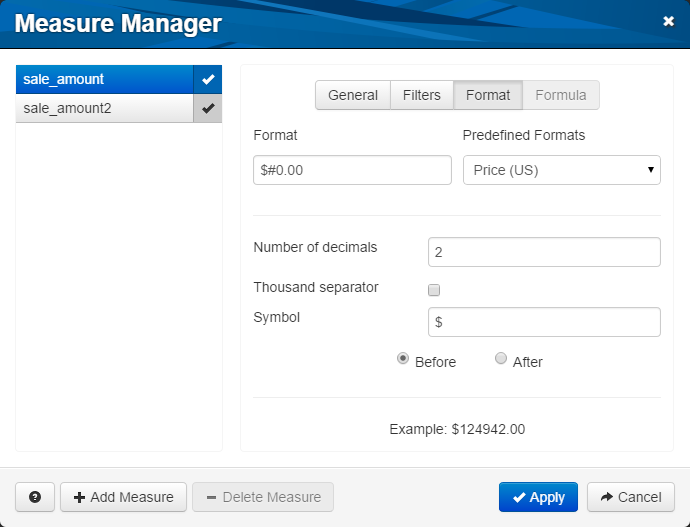
Format - Add characters manually before/after the number as desired, or use the options below to create the format string.
Predefined Formats - Choose from three predefined formats including Generic, Price (US), and Summa.
Number of decimals - Enter the number of places to retain past the decimal place.
Thousand separator - Check to insert comma separators.
Symbol - Enter the symbol(s) to include before/after the number.
Before/After - Specifies if the symbol should be inserted before the number or after it. The default is after.
Formula
The Formula tab is where you enter the formula that defines each of the custom measures that you add to the Measure Manager. This tab is only available for custom measures.
- To add a custom measure, click the + Add Measure button at the bottom of the window. Enter a name for your measure, and adjust any of the general/filter/format settings as desired. Notice how the Calculation Type on the General tab says "Calculated" since this is a custom calculated measure that will only exist for the duration of your session.
Go to the Formula tab to tell the Measure Manager how this measure should be created. The formula is started for you and you can add to it using any of the available measures and views.
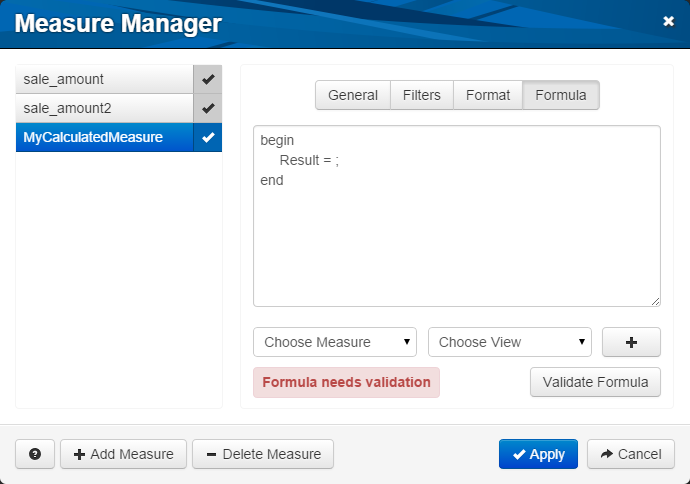
Place your cursor at the desired location in the forumula. Then, choose a measure and view, and click the + button to insert it:
![Result = "sale_amount"[VALUE];](../Resources/Images/Entering calc measure.png)
| View | Description |
|---|---|
| VALUE | The numerical value that is the result of aggregating the values from the data source. |
| COUNT | Count of the number of items. |
| RANK_BY_COL | All values in the column ranked by the size of the value. The largest value in the column is rank 1. |
| RANK_BY_ROW | All values in the row ranked by the size of the value. The largest value in the row is rank 1. |
| RUNNING_TOTAL_BY_COL | Vertical sum of values up to and including the current value. The last cell in the column will have the same value as the summary column. Note: The running total will make sense only for count-type measures such as Summa or Count. You may get strange results for statistical measures such as Min, Max, Average, etc. |
| RUNNING_TOTAL_BY_ROW | Horizontal sum of values up to and including the current value. The last cell in the row will have the same value as the summary row. Note: The running total will make sense only for count-type measures such as Summa or Count. You may get strange results for statistical measures such as Min, Max, Average, etc. |
| ROW | Total by row. |
| COLUMN | Total by column. |
| PREV_BY_ROW | Value in the previous row. |
| PREV_BY_COLUMN | Value in the previous column. |
| NEXT_BY_ROW | Value in the next row. |
| NEXT_BY_COL | Value in the next column. |
The following is an example formula. It assumes there is a measure named "Gift" and calculates the percentage of all gifts that each record makes up. You don't have to use all of the features that are in use here but this should give you a good idea of what the formula parser expects:
begin
var gift;
var giftTotal;
gift = "GiftAmt";
giftTotal = "GiftAmt"[COLUMN];
Result = gift / giftTotal * 100;
end;
When you have entered the formula, click Validate Formula to verify the syntax is correct before applying your measure changes to the OLAP cube.